Disclaimer: The solution below is a work-around and is not true Row-Level security and should not be used in it’s place. However, it will present as real RLS to the average end-user and enables additional functionality that I believe is key to a usefull Power BI report. Additionally, this post was written on 2020.11.01 for use in Power BI for Report Server (May 2020). As Power BI is updated every month, take the solution in context of it’s publishing date as future features may invalidate this work-around.
Navigation
- Introduction
- Problem Statement
- Data Structure
- Row Level Security Roles
- Visual Filters
- Put It All Together
- Closing Thoughts
Introduction
Microsoft’s Power BI is remarkable product that aims to be a data storage, ETL, visualization, and machinge learning product all in one. Now, I am no stranger to the Microsoft Stack. I know that there are several distinct products that are very well optimized and feature-rich in the aforementioned areas. But, what Power BI accomplishes is empowering users of varying skill levels to leverage the best parts of these products (i.e. Multi-dimensional Cubes from SSAS, Tabular reports from SSRS, Data Querying from SQL Server, etc.) in a user-friendly package. However, there is one feature that is present in SSAS that, if available in Power BI, could make a huge impact: dynamic row level security for different dimensions of the data model. Below is the methodology for how to implement this missing feature and bring Power BI one step closer to the tool to rule them all! 💍🌋
Problem Statement
Imagine a sales business that has multiple vertical levels to their sales organization (Employee < Team < Group < Country). Each level above employee will have many managers (See image below for an example). Employees and team managers all sell products (generate revenue) while group managers and country managers only manage people (do NOT generate revenue) and do not technically belong to any single organizational level below them (ex: Group 1’s manager does not belong to a team). Normally, it is possible to build a report using row-level security (RLS) for an organization structured in this way. However, if we want to allow lower-level employees to see the summarized information for higher-level organizations (ex: Team leaders should be able to see their group’s total sales) while also allowing them to see all employees that they oversee and compare themselves to their peers, this becomes much less intuative.

Data Structure
Security Table
Because RLS in Power BI filters the data tables before any measures or visuals are constructed, we will only use RLS to filter a special “Security” table (which will be hidden later). This table should have one unique row for each sales organization the employee should have permission to view as well as the employee’s email address, EmployeeID, and Security Level (more on this in a bit). Below is an example security table:
| EmployeeID | TeamID | GroupID | CountryID | Security Lvl | |
|---|---|---|---|---|---|
| [email protected] | 0002 | 1 | 1 | 1 | 1 |
| [email protected] | 0003 | 1 | 1 | 1 | 2 |
| [email protected] | 0004 | null | 1 | 1 | 3 |
| [email protected] | 0001 | null | null | 1 | 4 |
Some important things to notice here:
- There is only one entry per person (this is not the cartesian product of each employee and their superiors for all four organization levels)
- Group leaders and country leaders have null values for the organizations below them
- There are no sales numbers in this table
Sales Hierarchy Dimensions
Because we have structured our security table as we did above, we can use a traditional snowflake schema for our sales organizaion dimensions. This means that we will need three tables structured as follows:
DIM_Team
| TeamID | TeamName | GroupID |
|---|---|---|
| 1 | Team 1 | 1 |
| 2 | Team 2 | 1 |
| 3 | Team 3 | 2 |
| … | … | … |
DIM_Group
| GroupID | GroupName | CountryID |
|---|---|---|
| 1 | Group 1 | 1 |
| 2 | Group 2 | 1 |
| 3 | Group 3 | 2 |
| … | … | … |
DIM_Country
| CountryID | CountryName |
|---|---|
| 1 | Country 1 |
| 2 | Country 2 |
| 3 | Country 3 |
| … | … |
Sales Fact Table
There are two ways to structure your fact table. The first way is to have as little organization as possible (i.e. just employeeID, TeamID, and sales amount) and the second is to include the employee’s full organization structure alongside their sales figures (i.e. EmployeeID, TeamID, GroupID, CountryID, and sales amount). While both work, the former is the cleaner approach and thus I will recommend that. An example of a Sales Table would be like so:
| EmployeeID | TeamID | Sales |
|---|---|---|
| 003 | 1 | $100.00 |
| 010 | 1 | $250.00 |
| 045 | 2 | $10.00 |
| 004 | 2 | $100.05 |
After your Security, Dimension, and Fact tables are created, you should have a data model that looks like the following:

Row Level Security Roles
Now that we have our data in the right shape, let’s do the first layer of filtering with RLS. As mentioned previously, this step will only filter the “Security” table. For instance, viewing the report as Employee #4 should only yield the following row in our security table when we are done:
| EmployeeID | TeamID | GroupID | CountryID | Security Lvl | |
|---|---|---|---|---|---|
| [email protected] | 0004 | null | 1 | 1 | 3 |
This can be accomplished by creating a new RLS role and entring a DAX filter like the following for the security table:
[email] = userprincipalname()
This will only show the row in the security table that has the email of the viewer. We will referrence this entry with visual filters (more in the next section) to determine if a data point should be visible or not.
Visual Filters
🎉Congratulations🎉 for making it this far. Now that you’ve done the hard work of getting your data model in the correct shape, you can now utilize the magic that is dynamic row-level security filters! While I call these visual filters, they can also be applied to pages or entire reports if desired.
In order to make this work, you will need (at least) one measure for each heirarchy levels. In my example, this means four (Employee, Team, Group, Country). These measures should also return predictable values so that you can easily define them in a filter later. I use 1 and 0 (1 = row is visible, 0 = row is hidden) but you can choose what works best for you.
The pseudo code for your filter measures should be something like the following. The calculations will be done for each row of the current context. This means that if you have a table showing employee numbers, they will be calculated for each employee. If you have a table that is aggregating sales on a group level, then each “row” will be a group.
// Determine the Employee ID associated with the row of the sales fact table (if applicable)
// Determine the Team associated with the row of the sales fact table (if applicable)
// Determine the Group associated with the row of the sales fact table (if applicable)
// Determine the Country associated with the row of the sales fact table (if applicable)
// Determine the Security level of the employee viewing the report

// Determine if the Employee has the correct security level
// and
// if the employee belongs to the sales organization in question (calculated for each row of current scope)

// If both are true, show the row. If at least one is false, hide the row.
The example below is written for group level permissions:
GroupIsPermittedForView =
// Store information in variables about the user viewing the report
VAR SecurityLevel = Max('[N]Security'[SecurityLevel])
VAR GroupID = MAX('[N]DIM_Group'[GroupID])
VAR CountryID = MAX('[N]DIM_Country'[CountryID])
// Compare viewer's information against the current row's value
VAR SL3 = IF(AND(SecurityLevel <= 3, CONTAINS('[N]Security','[N]Security'[GroupID],GroupID)),1,0)
VAR SL4 = IF(AND(SecurityLevel = 4, CONTAINS('[N]Security','[N]Security'[CountryID],CountryID)),1,0)

return

IF(( SL3 + SL4) >= 1, 1,0)
Esentially what this is doing is comparing each row of the current scope to the employee’s credentials. If the report/page/visual is displaying group level data, we want to check that the viewer is either
- A group leader or
- A Country leader that oversees the group in a given row or
- An Employee/Team Leader that is overseen by the leader of the group in a given row
If any of these conditions is met, then we can show the row.
Now, with the measures created, you can add them as a filter to any visual or table. However, be sure to hide the filter (by clicking the eyeball next to the measure in the filter pane) so that a user cannot circumvent your security.
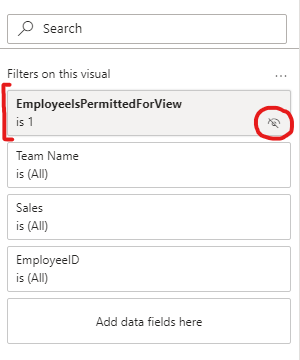
While you’re at it, you can hide the security table from your model so that users don’t even know it exists.
Put It All Together
In this artical we have covered the following requirements for this method of psuedo row level security:
- How to create a security table
- How to structure your Fact and Dimension tables
- How to define RLS roles
- How to build filtering metrics
- How to apply these filters to a visual
This basic implementation allows for heirarchical data filtering with the added ability to show summary data for higher level data. However, now that we are set up to use measures for filtering, there are many different customizations we can do. For instance, if we want to filter data based on continuous variables (rank within the company, sales revenue, etc.) rather than categorical variables (team, group, etc.) we can do that. If we want to only filter one visual and not another, you can do that. If you want to use your filter in another measure to alter the results, you can do that. I think you get my point.
If you would like to see how a dashboard looks using the method we described above, feel free to download the example PowerBI file here. This file compares different means of filtering data. For the purposes of the file I have named the Datasets, Pages, Filters, etc. to reflect the following ways to filter data:
- Traditional RLS: Filtering data using only Power BI’s built-in row level security features
- New RLS: Filtering data using the methods outlined in this article
- Hybrid RLS: A method described here which does allow for heirarchical filtering but does not allow for summary data of higher level sales organizations
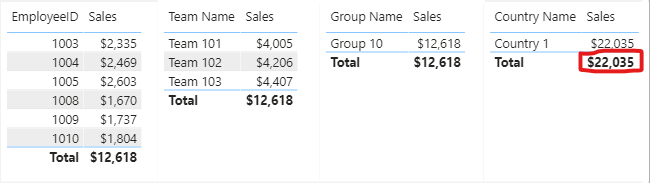
As a suggested example, try viewing the report as “[email protected]” and as a “Traditional RLS - Group 10 Leader”. If, after doing so, you view the “Traditional RLS” page, you will see that the total lines for each table is $12,618. This is because the data is filtered to only include Group 10 individuals.

However, if you view the “NEW RLS” report page as “[email protected]” and as a “New RLS - Sales” role then you will see that the tables look the same except for the country tables. This is beause this solution allows individuals to view summary information for higher level organizatiosn within one’s vertical.
Closing Thoughts
I want to conclude by reinforcing that this method is not a true version of row level security as all rows are still present in the data. However, I feel it provides a great alternative to those looking for a little more flexibility in their reporting.
That said, if you have any comments, questions, or concerns - please reach out to me on LinkedIn or GitHub and I’d love to hear them! I’m excited about this stuff and would love to hear from like-minded individuals!
Until next time! 🙋♂️📈